| Symbol | Exchange | Inception Date | CUSIP | Options |
|---|---|---|---|---|
| GK | NYSE Arca | 7/1/2021 | 00768Y370 | Available |
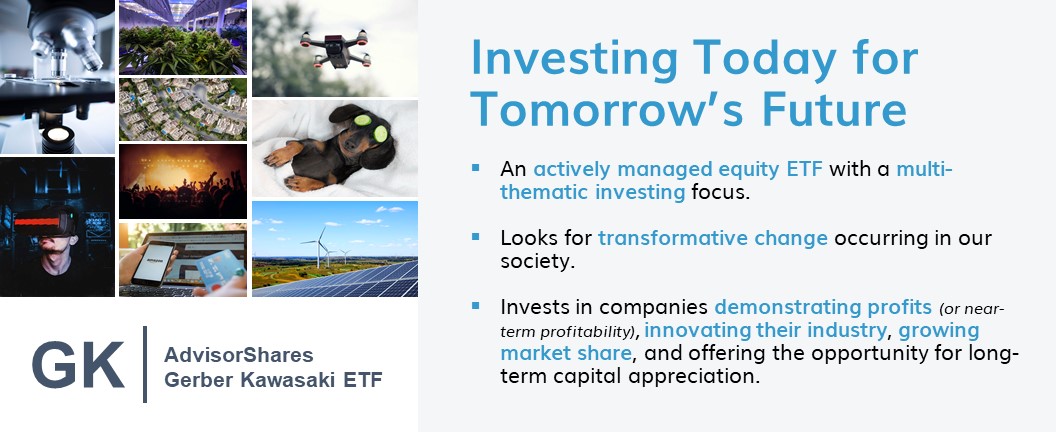
<strong>What Does GK Invest In?</strong>
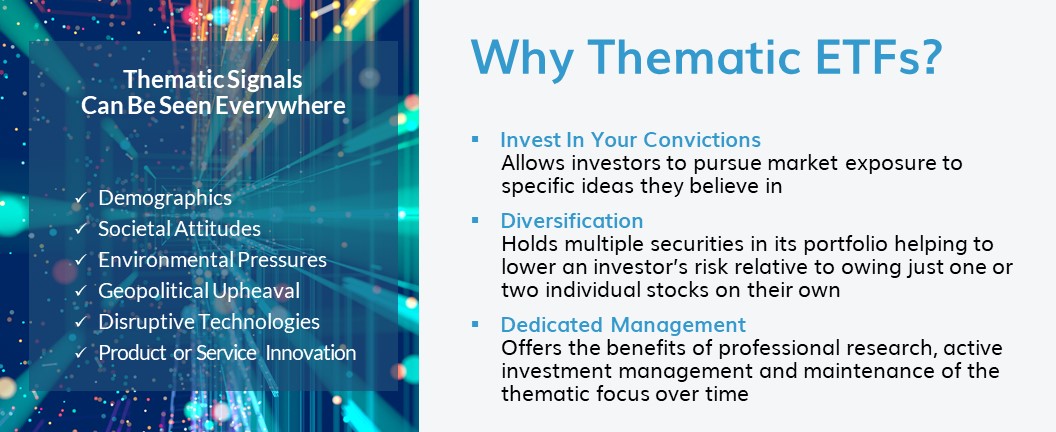
The goal of the AdvisorShares Gerber Kawasaki ETF (GK) is to identify growth companies positioned to benefit from transformative changes in our society. GK focuses on multiple investment themes with potential widespread impact to create a growth-focused portfolio of large, mid and small cap stocks. To uncover the evolving large-scale trends it invests in, GK looks for sustainable change occurring in demographics, societal attitudes, environmental pressures, geopolitical upheaval, disruptive technologies, and product or service innovation.
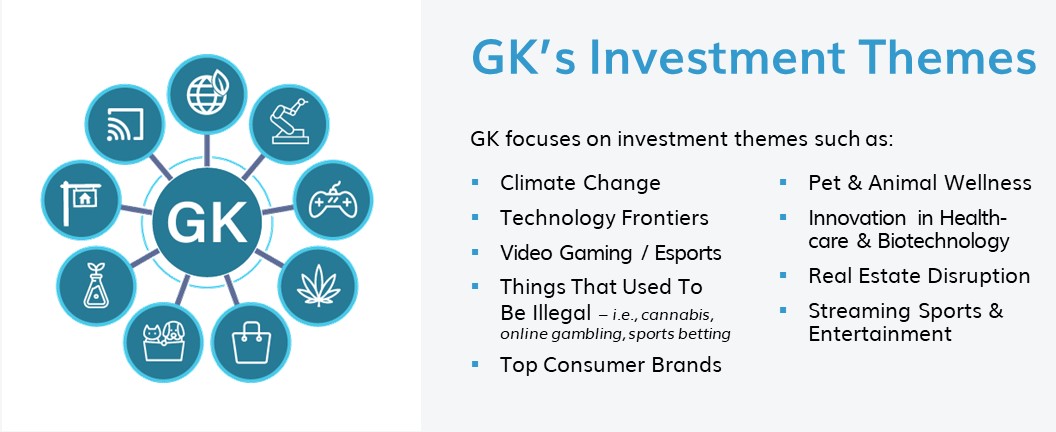
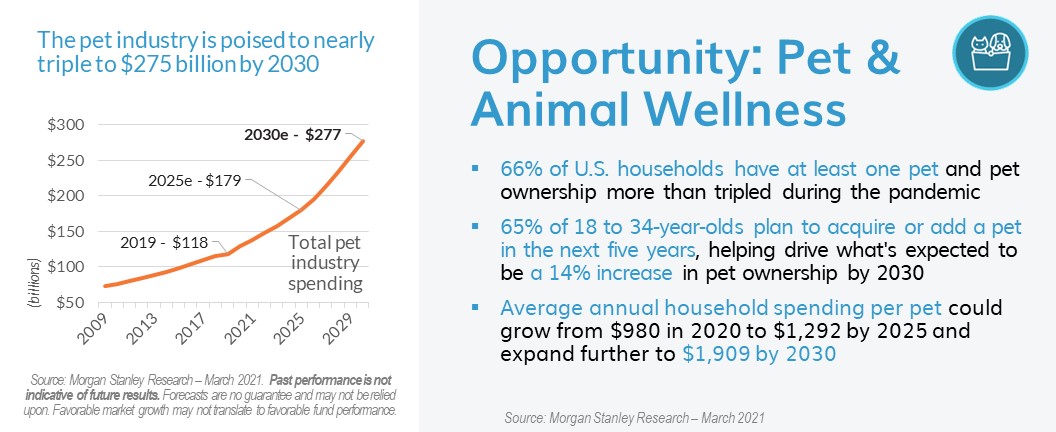
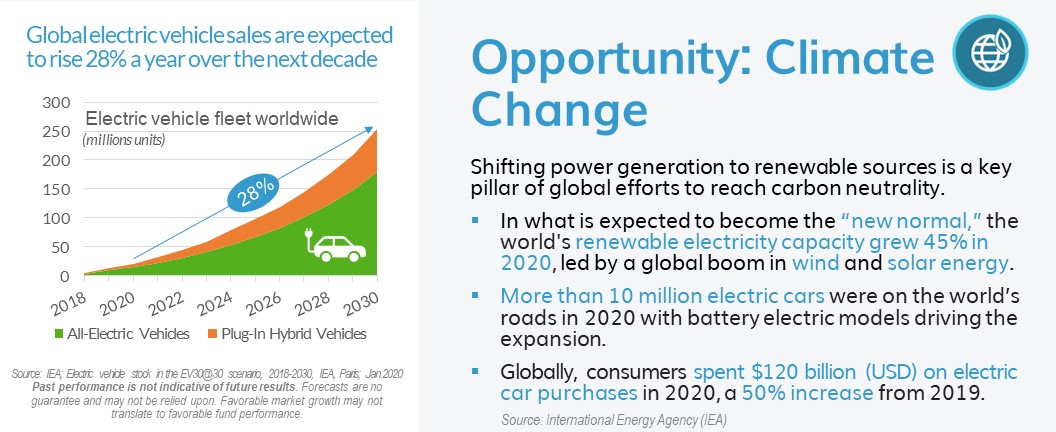
GK focuses on investment themes such as climate change – clean energy and transportation, technology/artificial intelligence/Fintech, video games – the new social media, things that used to be illegal – cannabis and online gambling, top consumer brands, the pet and animal wellness industry, real estate disruption as well as innovation in healthcare and biotechnology and streaming sports and entertainment.
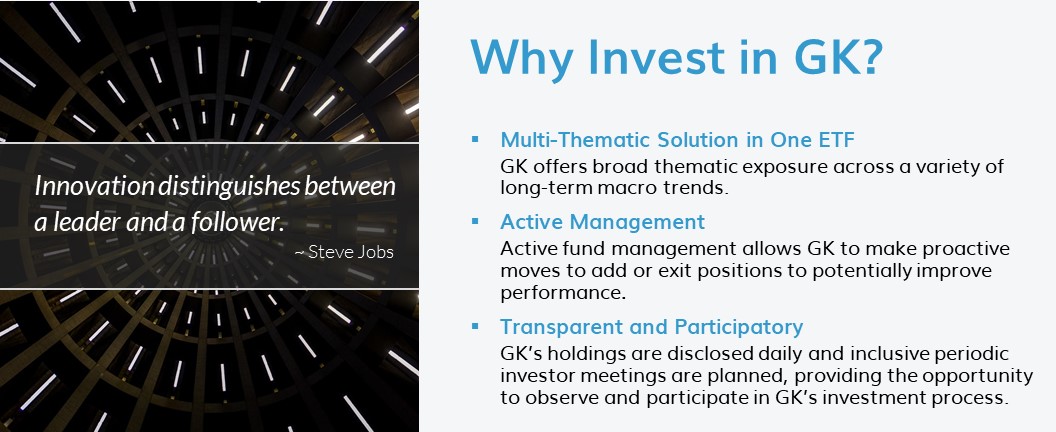
<strong>Why Invest in GK?</strong>
- Multi-Thematic Solution in One ETF – GK offers broad thematic exposure across a variety of long-term macro trends. GK’s portfolio manager, Ross Gerber, and the diverse investment team assisting him at Gerber Kawasaki are recognized for their depth of knowledge and experience in identifying emerging investment and economic trends.
- Active Management – GK invests in the stocks of companies the sub-advisor identifies as innovating their industry, growing market share, and offering the opportunity for long-term capital appreciation. Active fund management allows GK to make proactive moves to add or exit positions to potentially improve performance.
- Transparent and Participatory – GK’s complete holdings are visible to the public on a daily basis. The ETF will have inclusive periodic investor meetings, providing the opportunity to observe and participate in GK’s investment process.*
* ETFs use creation units, which allow for the purchase and sale of assets in the fund collectively. Consequently, ETFs usually generate fewer capital gains distributions overall, which can make them somewhat more tax-efficient than mutual funds.
<strong>Where Can GK Fit in a Traditional Portfolio?</strong>
<strong>Key Attributes</strong>
- People Drive Change – Because we believe people, rather than indexes, are better at identifying trends and reacting to changing market conditions, GK employs human insight and active portfolio management in its strategy.
- Capitalizing on Global Transformation – While ranging from emerging technologies to more widespread ideas, GK’s investment themes are based on high conviction, sustainable longer-term themes and trends believed to be transforming the world.
- Investing in the Future – Whether they be junior disruptors, established innovators, long-term leaders, or emerging evolvers, GK seeks to invest in both newer and well-known, established companies bringing innovative change to their industries and experiencing growing consumer demand.
- Tax Efficiency – By owning equities through an actively managed ETF such as GK, investors may be able to avoid the capital gain headaches that can occur from mutual funds or individual stock trading.
<strong>About the Portfolio Manager</strong>
Ross Gerber is the Co-Founder, President and CEO of Gerber Kawasaki Wealth and Investment Management, overseeing the firm’s corporate and investment management operations. Ross has become one of the most influential investors on social and traditional media and his investment ideas and advice have made him a regular in global business news as well on many of the most popular podcasts. He is a regular on Bloomberg, Reuters, Fox Business, Yahoo Finance, CNN, CNBC as well as a contributing writer for Forbes.com. Ross has worked in the financial investment industry since 1994.
Gerber Kawasaki was founded In 2010 by Ross and his business partner, Danilo Kawasaki. The firm oversees investment assets focused on technology, electric vehicles, consumer, media, and entertainment companies. Gerber Kawasaki is a leader in Fintech innovation leveraging technology and social media to work with a large diverse client base providing financial advice in scale. GK was listed in 2020 as one of the fastest-growing companies in Los Angeles according to the LA Business Journal. GK received several diversity and inclusion awards in 2020 within the financial industry and prides itself in representing the community.

GK Overview
Get an introduction to the GK ETF directly from the portfolio manager, Ross Gerber.
GK Overview
Get an introduction to the GK ETF directly from the portfolio manager, Ross Gerber.
Fund
Price History
Fund Data
4/22/2024| NAV | $19.20 |
| Change | $0.19 |
| Shares Outstanding | 1,025,000 |
| Assets Under Management | $19,675,384.34 |
Market Data
4/22/2024| Closing Price | $19.18 |
| Close Change | $0.20 |
| Volume | 1,265 |
Regulatory Data
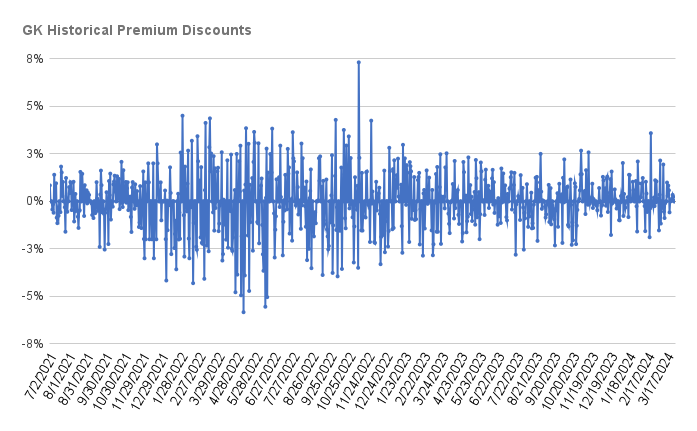
4/22/2024| Premium Discount | $0.000 |
| 30-Day Median bid-ask Spread | 0.19 |
Shares are bought and sold at market price (closing price) not NAV and are not individually redeemed from the Fund. Market price returns are based on the midpoint of the bid/ask spread at 4:00 pm Eastern Time (when NAV is normally determined), and do not represent the return you would receive if you traded at other times.

FUND
Characteristics
As of 3/31/2024
GK Sector Allocation
Source: Bloomberg & AdvisorShares
GK Market Capitalization
FUND
Performance
As of 3/31/2024
| NAV | Market Price Return | S&P 500 Index | |
|---|---|---|---|
| 1 Month | 3.81 | 3.90 | 3.22 |
| 3 Months | 14.76 | 14.86 | 10.56 |
| YTD | 14.76 | 14.86 | 10.56 |
| 1 Year | 22.08 | 22.24 | 29.88 |
| Since Inception (7/1/2021, Annualized) | -6.03 | -6.03 | 9.09 |
As of 3/31/2024
| NAV | Market Price Return | S&P 500 Index | |
|---|---|---|---|
| 1 Month | 3.81 | 3.9 | 3.22 |
| 3 Months | 14.76 | 14.86 | 10.56 |
| YTD | 14.76 | 14.86 | 10.56 |
| 1 Year | 22.08 | 22.24 | 29.88 |
| Since Inception (7/1/2021, Annualized) | -6.03 | -6.03 | 9.09 |
| Date | Account Symbol | Stock Ticker | Security ID | Security Description | Shares | Share Price | Market Value | Portfolio Weight | Asset Group |
|---|---|---|---|---|---|---|---|---|---|
| 04/22/2024 | GK | NVDA | 67066G104 | NVIDIA CORP | 2,266.00 | 795.18 | 1,801,877.88 | 9.16% | S |
| MGM | 552953101 | MGM RESORTS INTERNATIONAL | 38,132.00 | 42.43 | 1,617,940.76 | 8.22% | S | ||
| MSFT | 594918104 | MICROSOFT CORP | 3,847.00 | 400.96 | 1,542,493.12 | 7.84% | S | ||
| NVO | 670100205 | NOVO-NORDISK A/S-SPONS ADR | 10,366.00 | 125.26 | 1,298,445.16 | 6.60% | FS | ||
| GOOG | 02079K107 | ALPHABET INC-CL C | 8,047.00 | 157.95 | 1,271,023.65 | 6.46% | S | ||
| LEN | 526057104 | LENNAR CORP-A | 7,736.00 | 151.57 | 1,172,545.52 | 5.96% | S | ||
| DIS | 254687106 | WALT DISNEY CO/THE | 9,739.00 | 111.99 | 1,090,670.61 | 5.54% | S | ||
| AAPL | 037833100 | APPLE INC | 5,827.00 | 165.84 | 966,349.68 | 4.91% | S | ||
| LPLA | 50212V100 | LPL FINANCIAL HOLDINGS INC | 3,483.00 | 264.29 | 920,522.07 | 4.68% | S | ||
| NFLX | 64110L106 | NETFLIX INC | 1,578.00 | 554.6 | 875,158.80 | 4.45% | S | ||
| TT | G8994E103 | TRANE TECHNOLOGIES PLC | 2,638.00 | 291.15 | 768,053.70 | 3.90% | FS | ||
| ASML | N07059210 | ASML HOLDING NV-NY REG SHS | 772 | 872.05 | 673,222.60 | 3.42% | FS | ||
| BX | 09260D107 | BLACKSTONE INC | 4,619.00 | 122.09 | 563,933.71 | 2.87% | S | ||
| MSOS | 00768Y453 | ADVISORSHARES PURE US CANN | 58,051.00 | 8.57 | 497,497.07 | 2.53% | MF | ||
| LULU | 550021109 | LULULEMON ATHLETICA INC | 1,353.00 | 361.79 | 489,501.87 | 2.49% | S | ||
| IBIT | 46438F101 | ISHARES BITCOIN TRUST | 12,800.00 | 37.93 | 485,504.00 | 2.47% | MF | ||
| VICI | 925652109 | VICI PROPERTIES INC | 17,000.00 | 28.04 | 476,680.00 | 2.42% | S | ||
| ORCL | 68389X105 | ORACLE CORP | 3,901.00 | 114.53 | 446,781.53 | 2.27% | S | ||
| AMD | 007903107 | ADVANCED MICRO DEVICES | 2,606.00 | 148.64 | 387,355.84 | 1.97% | S | ||
| LVS | 517834107 | LAS VEGAS SANDS CORP | 7,120.00 | 46.56 | 331,507.20 | 1.68% | S | ||
| UBER | 90353T100 | UBER TECHNOLOGIES INC | 4,311.00 | 68.98 | 297,372.78 | 1.51% | S | ||
| AVGO | 11135F101 | BROADCOM INC | 200 | 1,224.46 | 244,892.00 | 1.24% | S | ||
| STLD | 858119100 | STEEL DYNAMICS INC | 1,779.00 | 137.3 | 244,256.70 | 1.24% | S | ||
| REGN | 75886F107 | REGENERON PHARMACEUTICALS | 268 | 900.16 | 241,242.88 | 1.23% | S | ||
| DELL | 24703L202 | DELL TECHNOLOGIES -C | 2,000.00 | 115.54 | 231,080.00 | 1.17% | S | ||
| HD | 437076102 | HOME DEPOT INC | 632 | 336.11 | 212,421.52 | 1.08% | S | ||
| ZTS | 98978V103 | ZOETIS INC | 1,400.00 | 145.54 | 203,756.00 | 1.04% | S | ||
| TSLA | 88160R101 | TESLA INC | 1,000.00 | 142.05 | 142,050.00 | 0.72% | S | ||
| AMZN | 023135106 | AMAZON.COM INC | 500 | 177.23 | 88,615.00 | 0.45% | S | ||
| SMCI | 86800U104 | SUPER MICRO COMPUTER INC | 50 | 717.02 | 35,851.00 | 0.18% | S | ||
| X9USDBLYT | BLACKROCK TREASURY TRUST INSTL 62 | 135,727.70 | 1 | 135,727.70 | 0.69% | MM | |||
| CASH | -76,035.69 | 100 | -76,035.69 | -0.39% | CA |
FUND
| Management Fee | 0.75% |
| Total Annual Operating Expenses | 1.33% |
| Fee Waver/Expenses Reimbursement(a) | -0.58% |
| Total Annual Operating Expenses After Fee Waiver/Expense Reimbursement | 0.75% |
(a) Total Annual Operating Expenses and Total Annual Operating Expenses After Waiver/Reimbursement in this fee table may not correlate to the expense ratios in the Fund’s financial highlights. For more information, please read the full prospectus. The Advisor has contractually agreed to keep net expenses from exceeding 0.75% of the Fund’s average daily net assets for at least one year from the date of the prospectus. For more information, please read the full prospectus.
Last Ten
Fund Distributions
- Before investing you should carefully consider the Fund’s investment objectives, risks, charges and expenses. This and other information is in the prospectus, a copy of which may be obtained by visiting the Fund’s website at www.AdvisorShares.com. Please read the prospectus carefully before you invest. Foreside Fund Services, LLC, Distributor.
- There is no guarantee that the Fund will achieve its investment objective. An investment in the Fund is subject to risk, including the possible loss of principal amount invested. Investing in mid and small capitalization companies may be riskier and more volatile than large cap companies. Because it intends to invest in value stocks, the Fund could suffer losses or produce poor results relative to other funds, even in a rising market, if the Sub-Advisor’s assessment of a company’s value or prospects for exceeding earnings expectations or market conditions is incorrect. Other Fund risks include market risk, equity risk, large cap risk, liquidity risk and trading risk. Please see prospectus for details regarding risk. Shares are bought and sold at market price not net asset value (NAV) and are not individually redeemed from the Fund. Market price returns are based on the midpoint of the bid/ask spread at 4:00 pm Eastern Time (when NAV is normally determined) and do not represent the return you would receive if you traded at other times.
-
Investing involves risk including possible loss of principal. The Sub-Advisor’s judgment about the markets, the economy, or companies may not anticipate actual market movements, economic conditions or company performance, and these factors may affect the return on your investment. When models and data prove to be incorrect or incomplete, any decisions made in reliance thereon expose the Fund to potential risks. In addition, the use of predictive models has inherent risk. Because predictive models are usually constructed based on historical data supplied by third parties, the success of relying on such models may depend heavily on the accuracy and reliability of the supplied historical data. The prices of growth stocks are based largely on projections of the issuer’s future earnings and revenues. If a company’s earnings or revenues fall short of expectations, its stock price may fall dramatically.
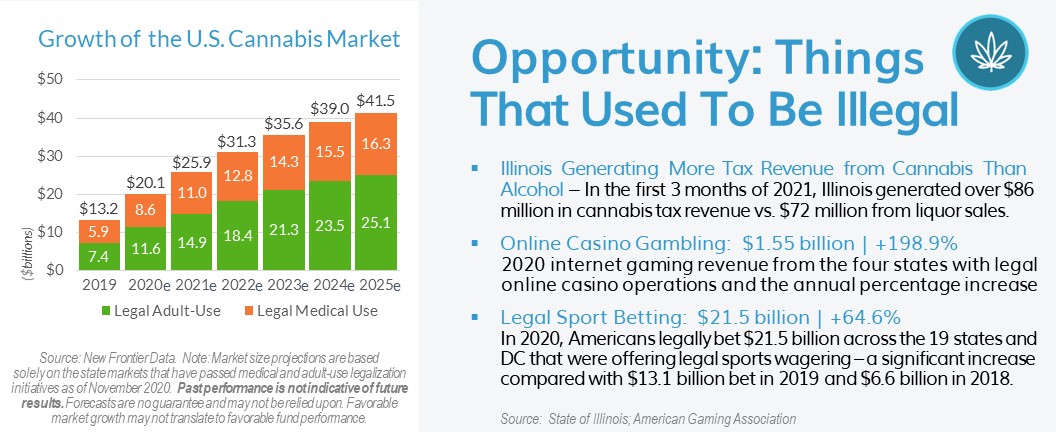
- Companies involved in the cannabis industry face competition, may have limited access to banks, limited resources due to litigation and are dependent on receiving necessary permits and authorizations to engage in medical cannabis research or to cultivate, possess or distribute cannabis. The possession and use of cannabis, even for medical purposes, is illegal under federal and certain states’ laws, which may negatively impact the value of the Fund’s investments.
The value of stocks of technology companies tend to be more volatile than the overall market and are vulnerable to rapid changes in technology, rapid product obsolescence, the loss of patent, copyright and trademark protections and government regulation and competition. The expansion of online gambling (both regulated and unregulated), including the award of additional licenses or expansion or relocation of existing gambling companies, and competition from other leisure and entertainment activities, could impact these companies’ finances. Companies within the biotech industry invest heavily in research and development, which may not lead to commercially successful products.
- Diversification does not guarantee favorable returns. While the fund invests across multiple thematic trends it is considered a “non-diversified fund” under federal law, the Fund may invest a greater percentage of its assets in a particular issuer and hold a smaller number of portfolios securities
ETF
Social
Conversation